Note: Only last two major versions of browsers are fully supported.
Search
Search Languages
To search immediately for a language community start typing in the “Search Languages” search bar and select a language or a specific community from the dropdown menu. Search by English name or endonym, the language name that speakers themselves use for their own language, in the appropriate script. Those familiar with ISO 639-3 language codes or Glottocode can also search with those.
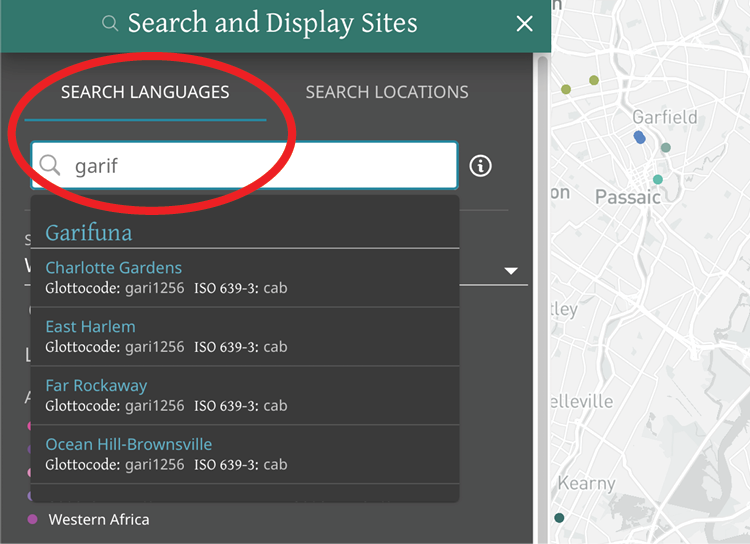

Selecting the language name (for example, “Garifuna”) will take you to a profile of the language (without changing the map). Selecting a language site (for example, “Charlotte Gardens”) will take you a description of the language community at that location and will zoom you toward that site on the map. Note that larger languages are deliberately underrepresented, so the maximum number of sites allowed for any given language is currently 7, with the exception of Lenape—the Indigenous language for much of the region.


Search Locations
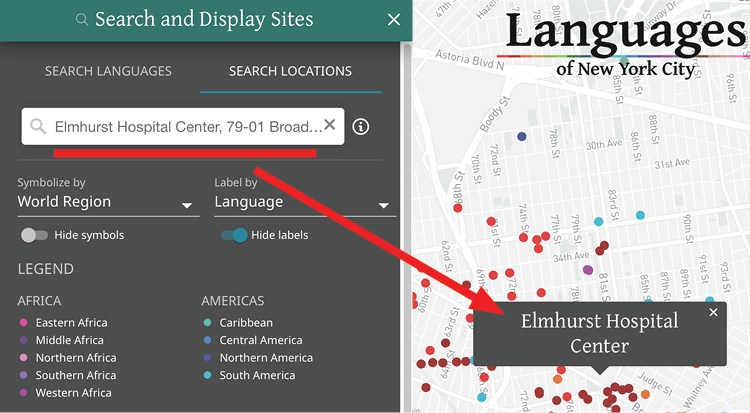
Searching by location simply takes you somewhere on the map so you can see the languages near there (NYC metro area only). Searchable locations include addresses, postal codes, landmarks, neighborhoods, and municipalities. For instance, a search for Elmhurst Hospital Center will bring you to a dropped pin on the map, from which you can explore the surrounding languages.
(For a closer look at neighborhoods and counties on the map, including their boundaries and the languages spoken in them, use “Map Options,” the layers button on the upper right hand side.)

Symbols and Labels
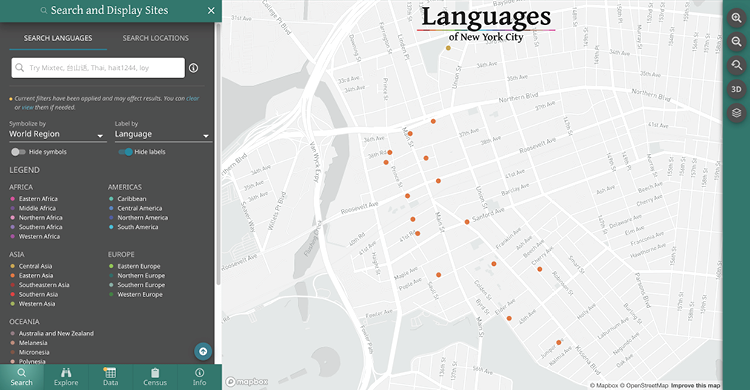
Use the back button or click “Search” to return to the initial view. Two dropdowns with toggles allow you to change the way communities appear on the map.
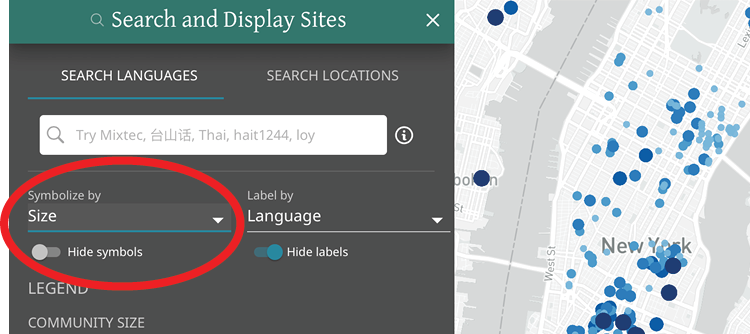
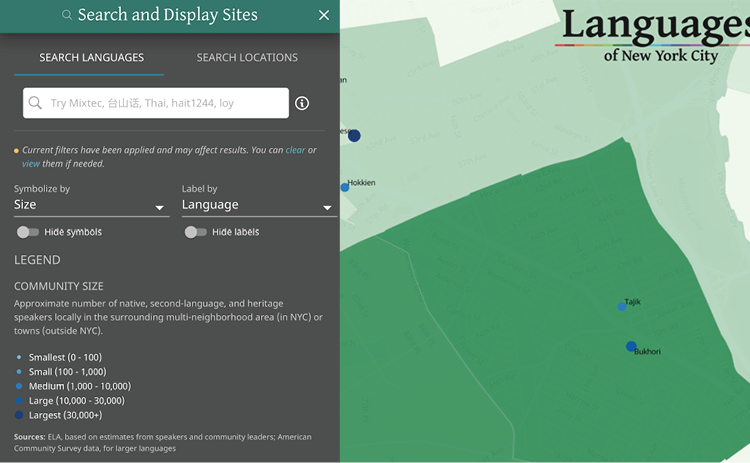
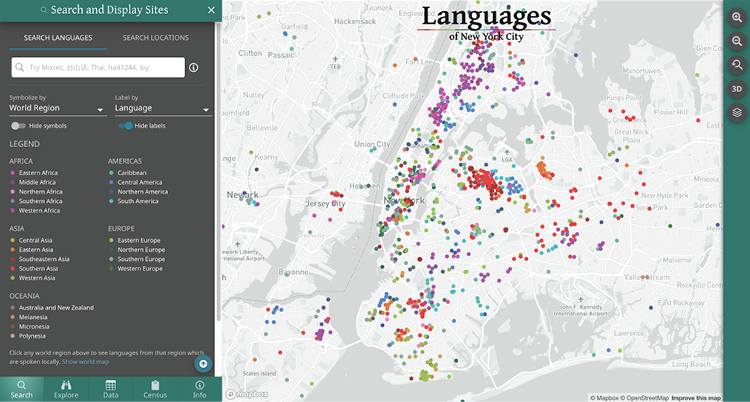
Instead of seeing language communities represented by colorful points, with different colors representing different world regions, you can view languages by the size of the local speaker community. Under the dropdown menu titled “Symbolize by,” select “Size,” which both alters the map and brings up a new legend on the left:

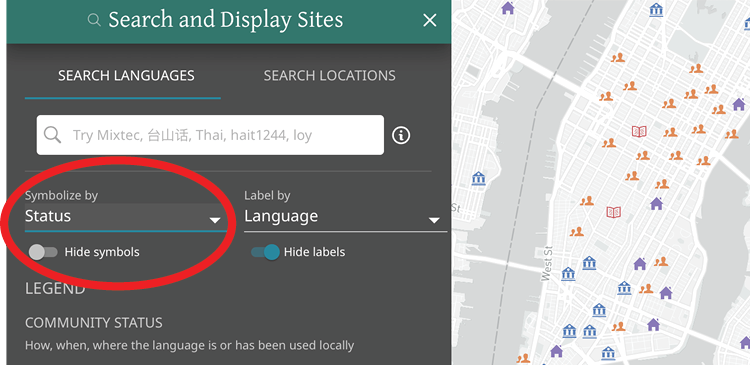
To view languages by the status of the local speaker community, select “Status” under “Symbolize by.”

Only a fraction of the icons will be visible when you are zoomed out. You must continue zooming in to see all icons.
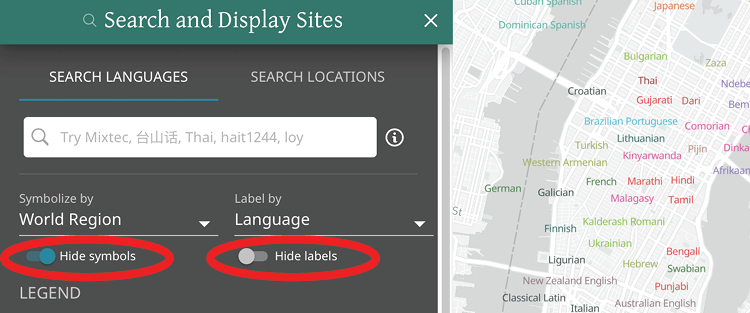
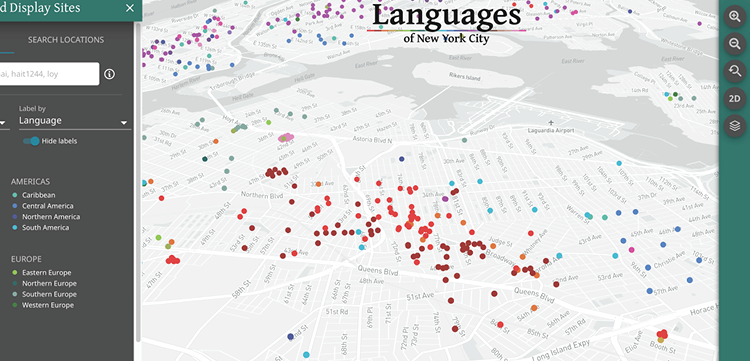
To view languages on the map labeled by language (English name) or endonym, use “Label by.” Labels are hidden by default, so slide the “Hide labels” toggle to turn them on. You can slide the “Hide symbols” toggle off if you just want to see labels.

Only a fraction of the labels will be visible when you are zoomed out. You must continue zooming in to see all labels.
One way to see a list of all New York languages from a particular world region (e.g. East Africa) is to click on that region in the legend. The map does not change, but you are now in the “Explore” section, where you can drill down into lists of languages by region, neighborhood, etc.
Explore
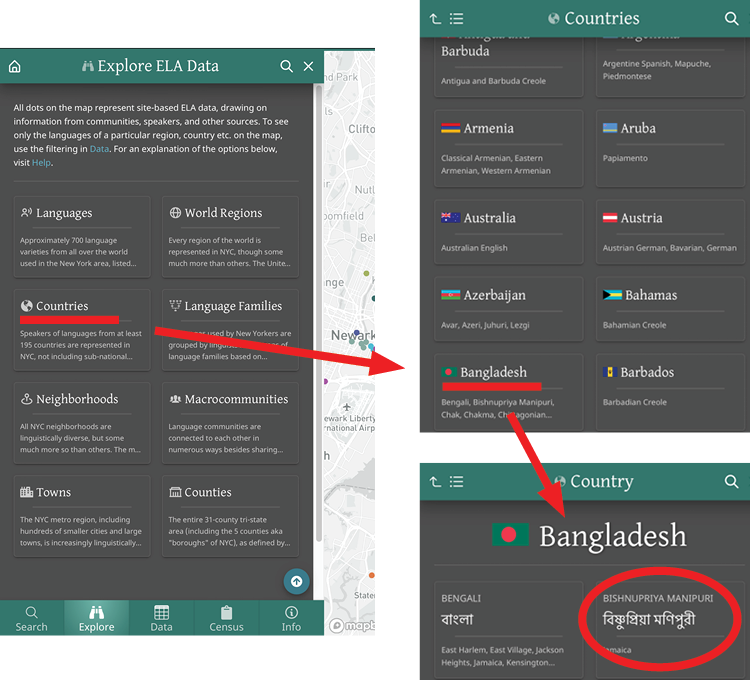
“Explore” provides options for learning more about different types of language communities. This is a good place to find readymade lists of languages by region, country, language family, neighborhood, etc. Each of these has a unique URL which can be copied and shared from your browser toolbar.
Across the site, whenever you can click on a region, country, etc., you will be taken to the relevant page in “Explore.”
Note that the points on the map will not change while you use “Explore.” To see only the languages of a particular region, country, etc., on the map, use the filtering in “Data.”
You can use the navigation menu on the top left, or the one-level-up button, to move easily back up the nested categories at any time, including all the way to “Search.” You can also use the magnifying glass to search for languages and locations, just as you can on “Search” (where it is open by default). (where it is open by default). Choosing X in the upper right hand corner simply shrinks the panel, which can be maximized again.
In this example, we select Bangladesh from the list of countries and then Bishnupriya Manipuri from the list of the languages of Bangladesh spoken in New York.

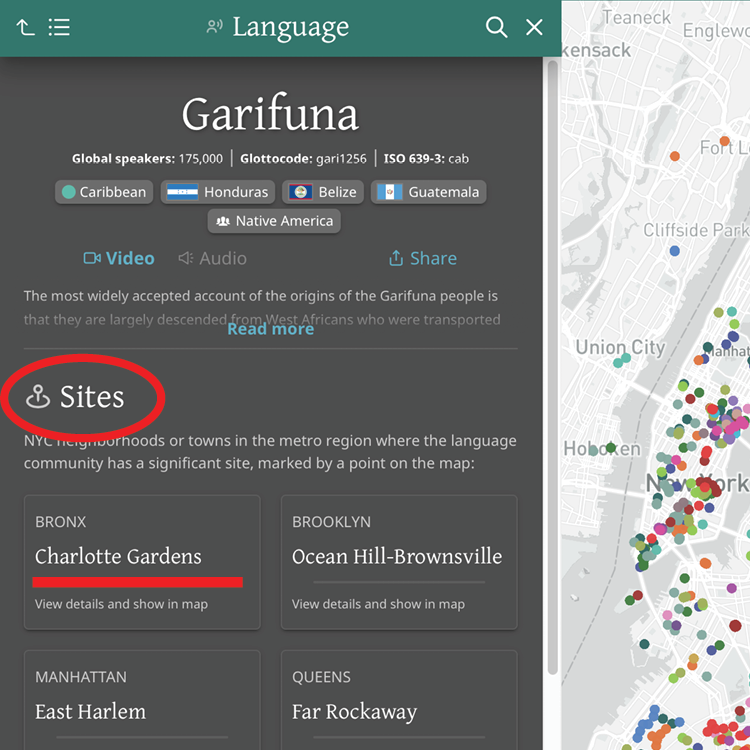
Language Profile
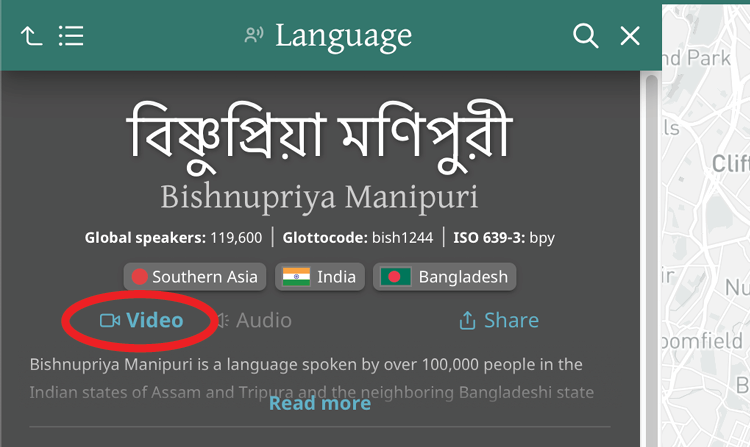
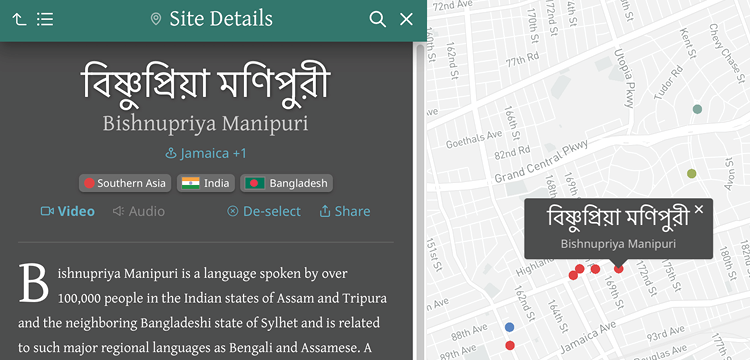
The “Language Profile” (shown below) provides numerous jumping-off points for further exploration.
At the top in white is the endonym (the most common name for the language used by its speakers) in the most commonly used writing system, and below that (if available) is the language name in English / used by linguists.
Clicking on Southern Asia, India, or Bangladesh will take you to “Explore” pages where you can see all of the languages associated with those places.
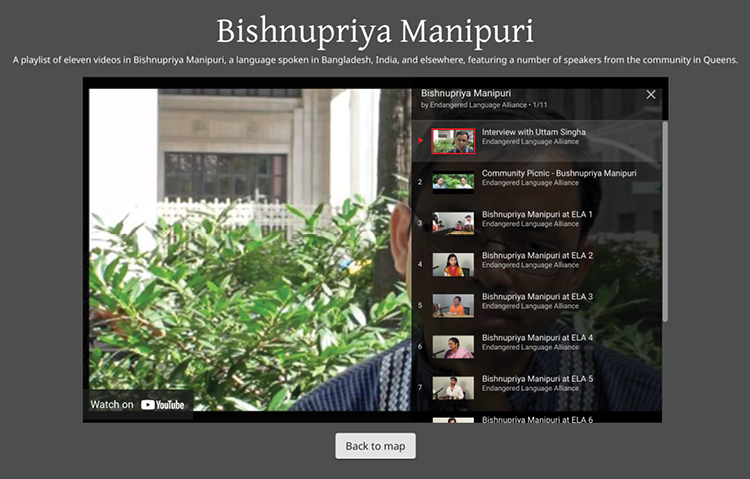
If there is an ELA video or audio recording available for this language community, you can select that and a modal dialog with the video or audio recording will appear. Videos are embedded from YouTube, and audio recordings from the Internet Archive. To see all communities for which there are recordings, go to “Data” and filter using the corresponding checkbox column.

Note that most recordings are in playlists, so there are a lot to check out. Many of the videos are subtitled in English and sometimes in the language itself. Just make sure to click CC (for subtitles) inside the YouTube player.

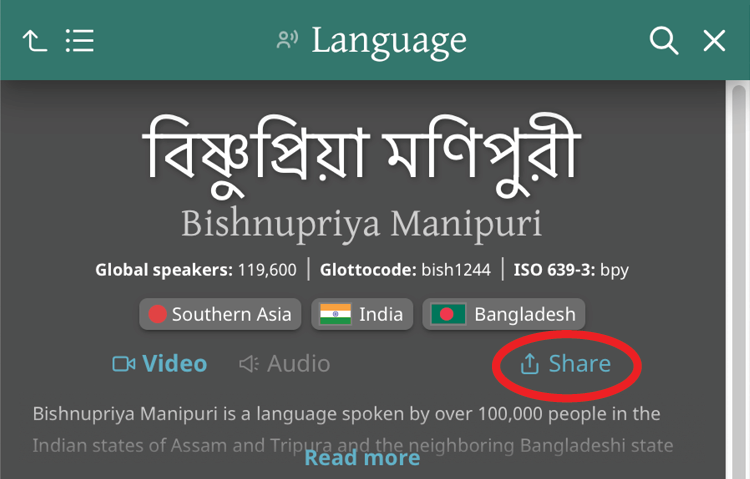
You can also quickly and easily share the unique, unchanging link to the selected language community on various social media networks or by email.

In some cases you will also see a block of collapsible text (“Read more”) containing background information about the language or the language as used in NYC.
The “Language Profile” represents the language at all its locations across the metropolitan area.
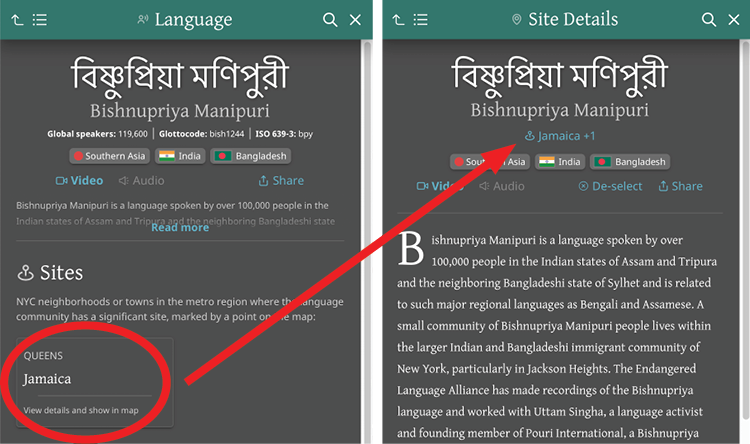

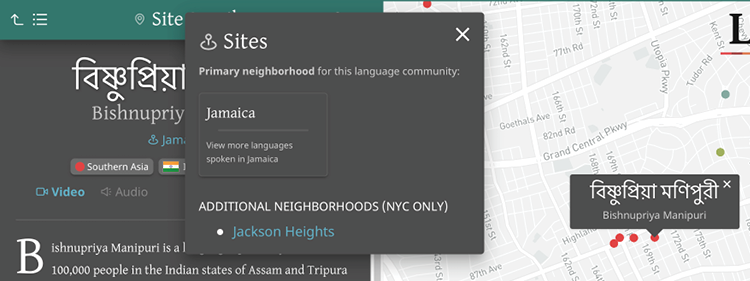
Selecting a primary location, in this case Jamaica, will take you to the Jamaica community of Bishnupriya Manipuri speakers on the map and the accompanying “Site Details” text.
Additional neighborhoods — Jackson Heights in this example — are NYC locations where speakers of the relevant language may also be found, but for which there are no dots on the map. Clicking on Jackson Heights will take you to a page where you can see all of the languages spoken in that neighborhood.
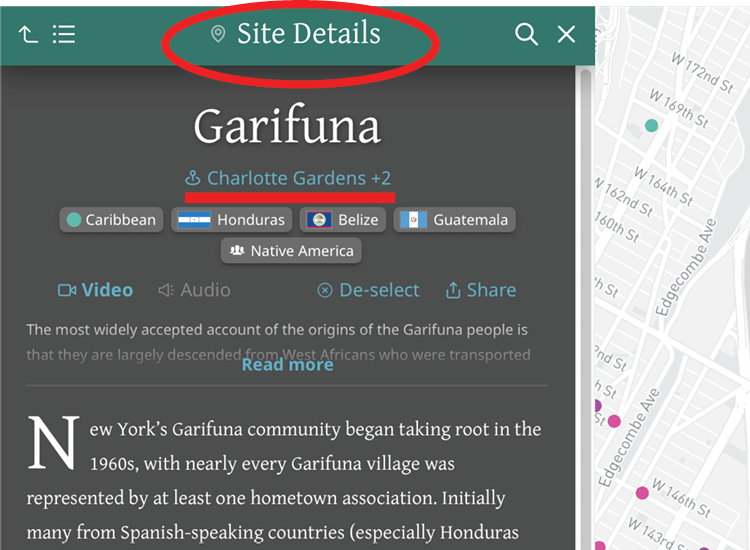
Site Details
“Site Details” is the place for in-depth information about any single site or language community in the metropolitan area. Any time you click a dot on the map, “Site Details” appears in the left panel with it. Here we see the Jamaica community of Bishnupriya Manipuri speakers.
“Site Details” shares many features in common with the “Language Profile.” The main difference is that “Site Details” gives information specific to just that point on the map (a significant site for speakers), while the “Language Profile” covers the language as spoken across the metropolitan area.
Clicking on this takes you to a landing page in “Explore,” which contains links to other pages in “Explore” where you can find other languages used in the same neighborhood, world region, country, or macrocommunity (if available).
If a language is spoken in multiple adjacent or nearby NYC neighborhoods, you will see +1, +2, etc. next to the neighborhood name. These are not all of the additional neighborhoods, but only the ones associated with this site.

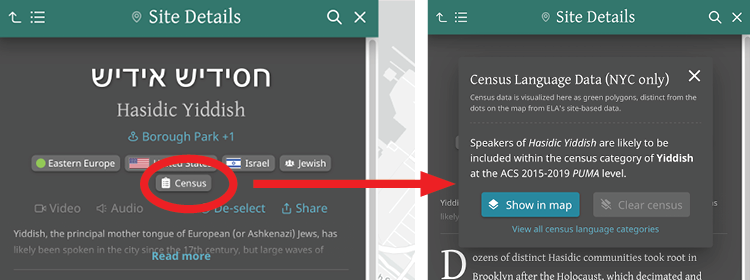
There is also a “Census Language Data” pop-out allowing you instant access to the most relevant census data (if available). If you already have a census layer turned on, you can clear it here as well.

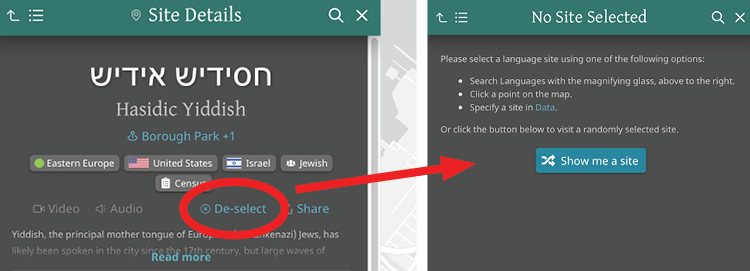
De-selecting allows you to reset the page and either click on a new dot in the map to see “Site Details” about a different community. Or try “Show me a site.”

Data
“Data” is the place for advanced searching, filtering, and querying, by changing which dots appear on the map.
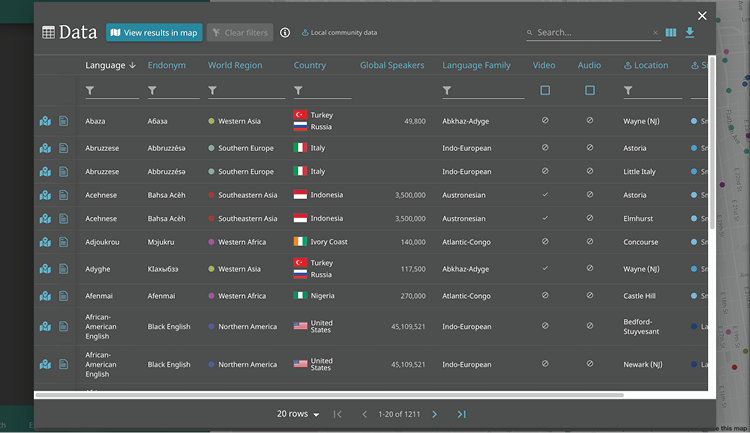
Below is the default view, showing all records that appear with a dot on the map. You can customize your view by selecting the number of visible rows (10, 20, or 50). You can also drag to reorder columns. For most, you can sort the table alphabetically or reverse alphabetically by clicking the little arrow to the right of the column headings. In the upper right hand corner, you can hide columns, and export your view to CSV and PDF. To leave the table without affecting the map, click X to close.
Note that PDF export has limited support for non-Roman characters, but will contain a link, also available in the “About” section, to the fully supported dataset in Airtable.
The two green icons to the left of each row allow you to go directly to that community in the map and to get more details, including a text description, while staying in the table. The columns with “Local community data” refer specifically to New York-area language communities. The “Glossary” explains what each column represents.

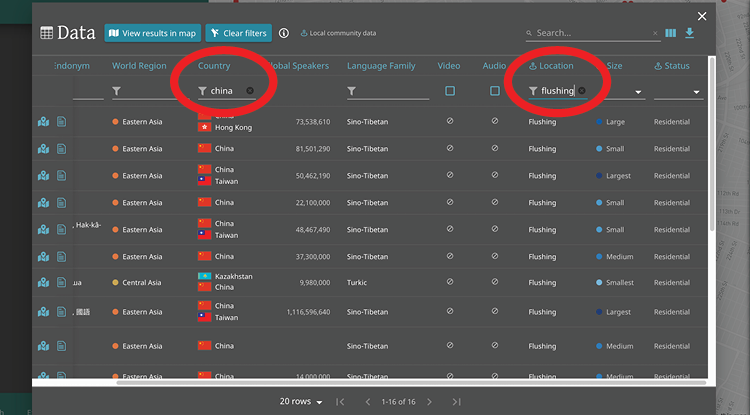
The top-right search bar searches across all of the data. For more precise results, you can also filter columns individually either by typing next to the filter icon or by clicking on any word in the table. For “Size” and “Status,” there is a dropdown selection allowing multiple options. The example below filters the data for languages of China spoken in Flushing, Queens, with 16 results.

After filtering, select “View results in map” to see only your filtered data in the map, with all other dots removed. Below is the view for the languages of China spoken in Flushing. You can click any dot to learn more about that language community.

Remember that once you have filters set, they will stay in place until cleared. Any action that you do anywhere on the site will be constrained by any filters you have turned on. Filters can be cleared from “Search” or “Explore,” or back in “Data” itself, where first you clear the filters and then again select “View results in map.”
Census
“Census” is where you can view data layers from the latest American Community Survey (administered by the US Census) and compare it with the point-based ELA data the map is based on.
To turn on a “Census Language Data” layer, choose a language or enter text in the dropdown search. For larger languages, there is detailed data represented at the census tract level; for all others, there is less detailed data across the larger areas known as PUMAs, each of which is typically the size of multiple NYC neighborhoods. Note that selecting a language zooms you out to the map’s initial extent unless you slide off that toggle, but you can zoom in and out at will.
The order of languages in the dropdown is from the most widely spoken languages to the least. Note that because of Census sampling, tabulation, and data-gathering procedures, the data becomes less and less reliable towards the bottom of the list. Layer names follow Census Bureau categories, which may be unclear and may not match language names used by communities and in the rest of the map. We provide this information largely for comparison with the linguist-vetted ELA dataset used in the rest of the map.
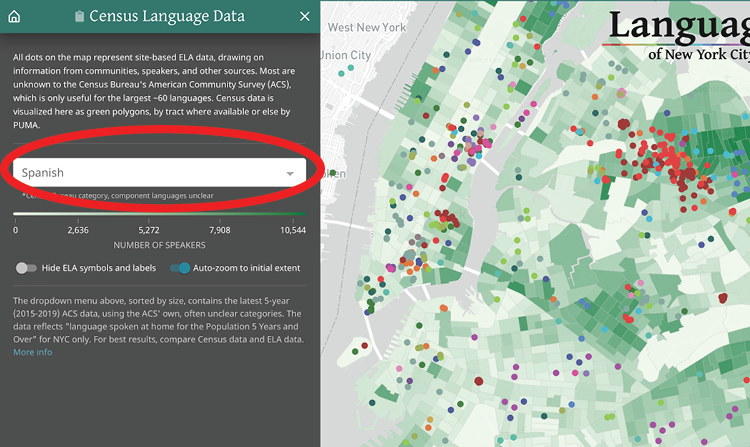
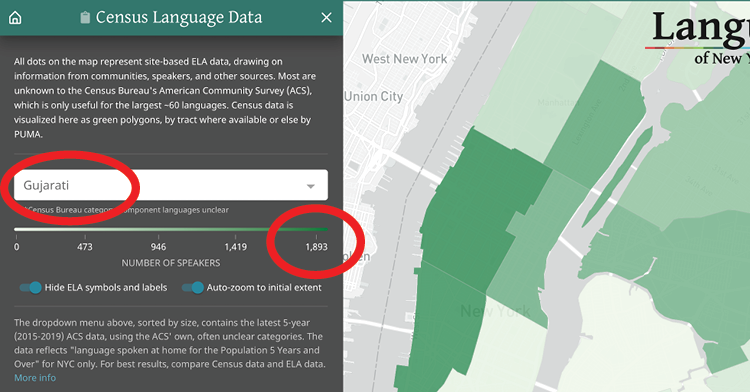
In the examples below, we see tract-level Census data for Spanish and PUMA-level Census data for Gujarati. While Gujarati is widely spoken, there are many times more speakers of Spanish in NYC.
Varying shades of green represent the relative distribution of speakers in different tracts or PUMAs — with the darkest shade representing the highest concentration, and white meaning no concentration. See the legend for the maximum number: In other words, the census tract with the most speakers in NYC has 10,544 speakers.

You also have the option to hide ELA’s data if you only want to see Census data (with no dots, labels, or symbols on the map). Note that when turning it back on, you will see both dots and labels. To just see one or the other, use the options back at “Search.” Here we see PUMA-based for Gujarati, where the most Gujarati-speaking PUMA has 1,893 speakers.

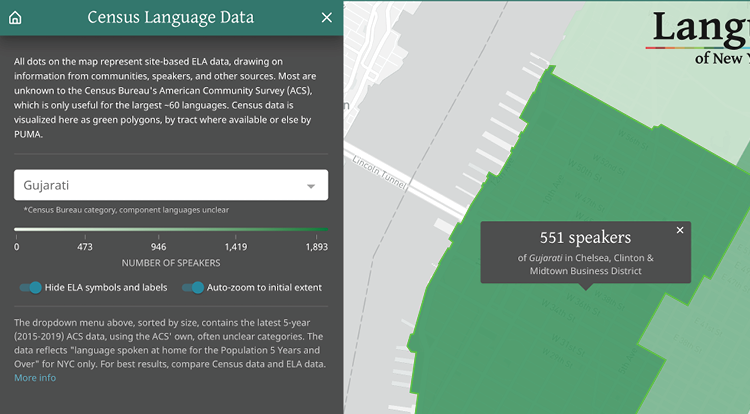
Click on any census tract or PUMA to zoom to and get the number of speakers for that unit.

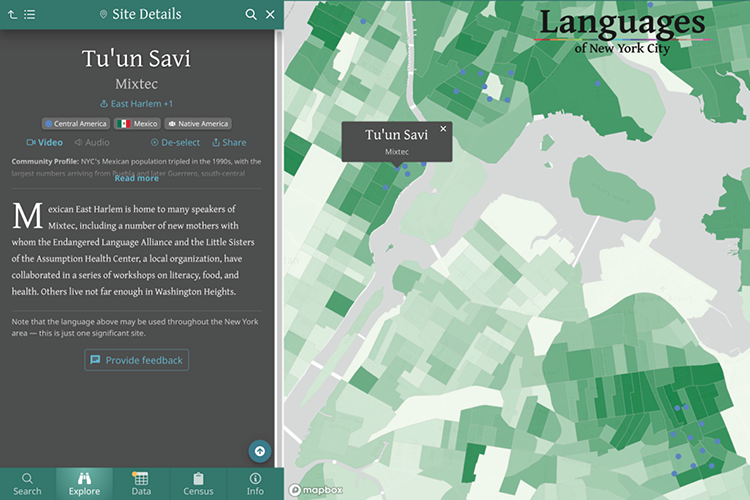
Selecting a census layer while also filtering map data can produce intriguing results, as in this comparison of Spanish-speaking census tracts (in green) and Indigenous languages of Latin America (blue and purple dots).
The map illustrates the point, confirmed in research by the Endangered Language Alliance and others, that many who are counted as Spanish speakers also or primarily speak Indigenous languages — one example being Tu’un Savi (or Mixtec), which has a community of speakers in East Harlem.

Many other kinds of comparison are possible when overlaying the ELA data in the map with census layers.
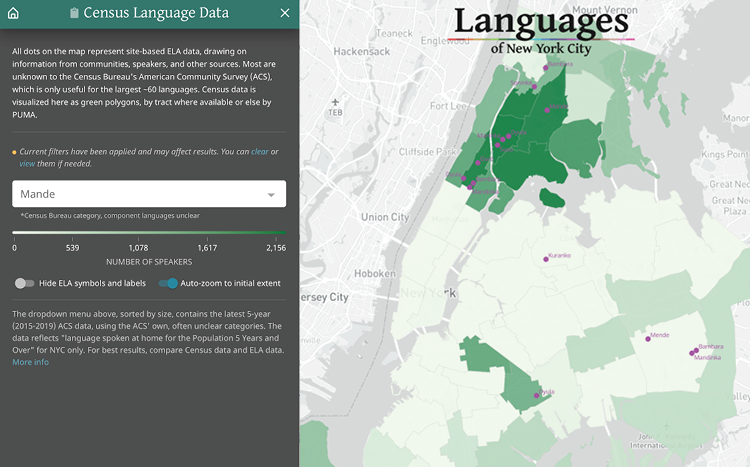
For example, Mande, listed as a single language in the Census data, is considered a language family with many component languages in the map. By selecting Mande in the Census dropdown and filtering the map for Mande in the “Data” table, you can make a detailed comparison of the gap between the Census data and linguistic realities on the ground.

Comparison may also help clarify Census information that is otherwise unclear or hard to use. How you customize your view is up to you. Consider these steps:
- In “Census,” turn on the “Other Indo-Iranian” census layer
- In “Data,” filter by “Region” (Asia) and by “Size” (Medium, Large, and Largest)
- In “Search,” “Symbolize by” Size and “Label by” Language
Zooming in on an area of Eastern Queens with a concentration of “Other Indo-Iranian” speakers according to the Census, we can surmise that many are likely to be speakers of Tajik or Bukhori.

Map Options
On the right side of the map itself, there are five buttons with different functions allowing further exploration and visualization on the map.
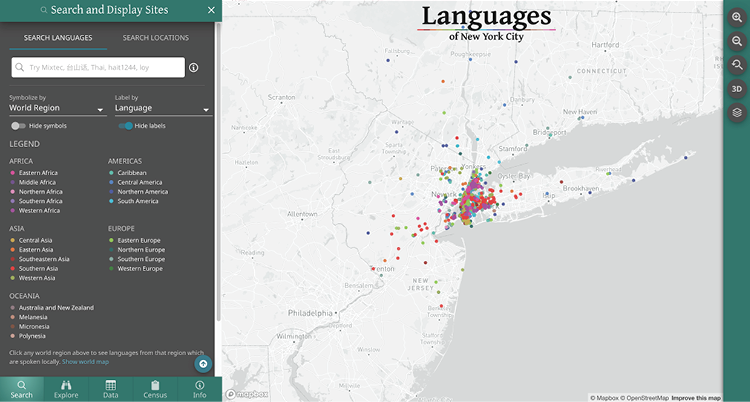
In addition to zooming in and out, there is a “Reset zoom” button which restores the initial extent of the map, focused on NYC. To see every language in the metropolitan area, zoom out further.


The “3D” button is off by default, but can be turned on and off as needed.

The “Show map options” button contains multiple options.
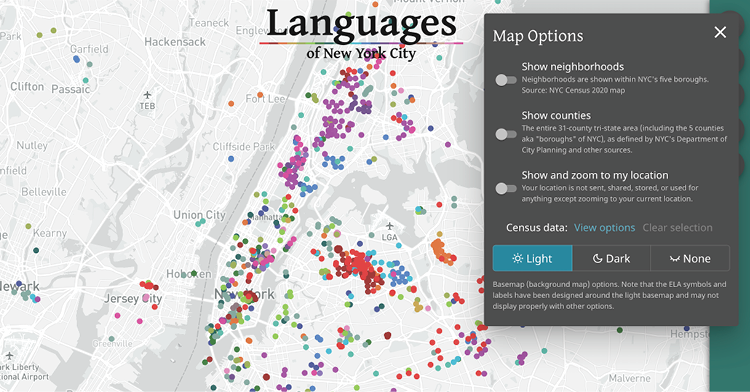

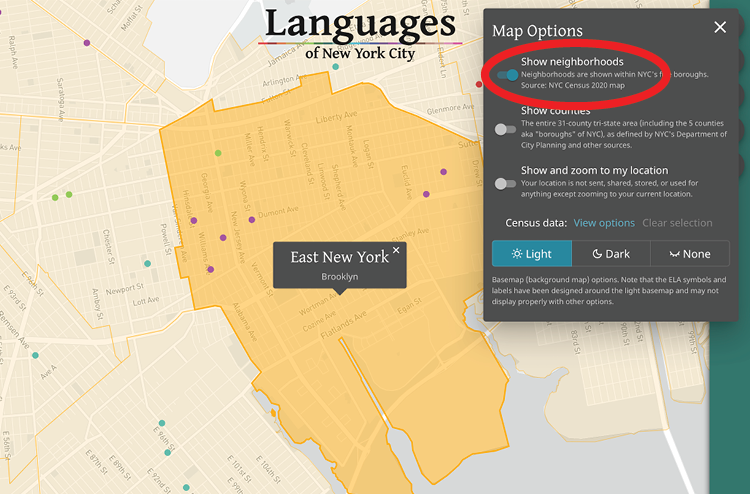
To orient yourself on the map, toggle on “Show neighborhoods” or “Show counties” to see the boundaries of each. Clicking on the map in any given neighborhood or county will zoom you to that polygon, display a pop-up with the name, and open the relevant information in “Explore.”

To see the languages around your current location (in the NYC area), toggle on “Show and zoom to my location.” Your browser will ask your permission to use your location data — this information will not be used or kept and will remain confidential.
In this example, the pulsing, larger blue dot indicates that the user is in Ridgewood, Queens. Zoom in or out to find the right level to explore the nearby languages. The dot should move as you move, but there may be some lag — refresh or reset occasionally for best performance.

You can also turn off “Census Data” layers in “Map Options,” and even experiment with different basemap (background map) views: light, dark, and none.
Glossary
Language: most common language name in English, or as used by linguists
(Source: ELA)
Endonym: most common language name used by its speakers, in the most commonly used writing system*
(Source: ELA)
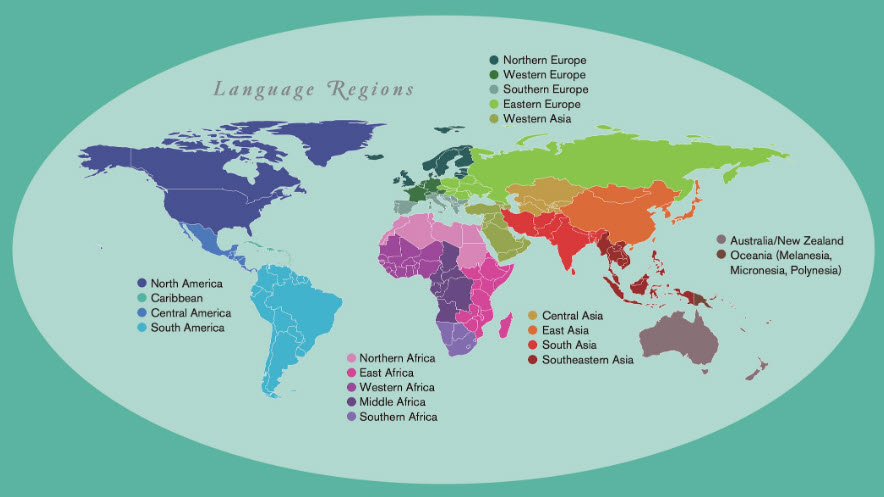
World Region: region or subregion, smaller than a continent, as defined by the United Nations geoscheme (see below). For purposes of categorization, each language is assigned to a single region based on the primary country where it is spoken.
(Source: Ethnologue)

Countries: primary (estimated to have the largest concentration of speakers) and secondary country where the language is spoken
(Main Source: Ethnologue)
Global Speakers: estimate of the total number of speakers in the world*
(Source: Ethnologue)
Language Family: group of languages, related through descent from a common ancestral language, to which a given language belongs
(Source: Glottolog)
Neighborhoods: local name, for NYC locations only, for primary (estimated to have the largest concentration of speakers) and other significant neighborhoods
(Principal Source: ELA)
Neighborhood names and boundaries are modified the NYC Census 2020 map (a city-wide outreach effort not affiliated with the US Census).
Size: local number of native, second-language, and heritage speakers locally in the surrounding multi-neighborhood area (in NYC) or towns (outside NYC)
(Sources: ELA, based on estimates from speakers and community leaders; American Community Survey data, for larger languages)
Scale — Smallest: 0-100 speakers, Small: 100-1,000, Medium: 1,000-10,000, Large: 10,000-30,000, Largest: 30,000+
Status: how, when, where the language is or has been used locally
(Source: ELA)
- Historical: speakers of the language formerly lived in the area and used the language there in significant numbers, which have diminished today
- Community: current speakers of the language may not live in the area, but gather and use the language on a regular basis at a significant site in the area
- Liturgical: clergy or worshippers use a language strictly for religious purposes, usually a language no longer used in everyday life
- Residential: current speakers of the language live in the area and use the language at home and possibly in other settings
- Reviving: primarily second-language speakers revive a language through teaching
Macrocommunity: larger cultural, geographic, or religious community with which a language community may associate in NYC*
(Source: ELA)
Video: sample video recording or playlist from ELA*
(Source: ELA)
Audio: sample audio recording or playlist from ELA*
(Source: ELA)
*May not be available for all data